The basics of email statistics
You have segmented your database, created the content, personalised your email and sent it. All this in order to generate the largest possible reach of your message in order to activate as many contacts as possible. And now you’re curious about the result! But how do you interpret the statistics of your email? What do these numbers and percentages represent? The basis of email statistics is set out in the so-called S.A.M.E. definition.
S.A.M.E. definition
S.A.M.E. stands for Support the Adoption of Metrics for Email and is a standard definition of email statistics, establishing the criteria for being counted as, for example, “unique open” or “unique click”. Furthermore, the statistics are displayed here in an accurate and uniform manner and, therefore, are comparable with other ESPs. You can use this for interpreting the email statistics and for a benchmark between different ESPs.
Send data
Total emails sent
The total number of email messages sent.
Hard bounces
A hard bounce is an email message that is returned to the sender because the recipient address is invalid. A hard bounce may occur because the domain does not exist or because the recipient’s address is unknown. The percentage of hard bounces is calculated based on the total emails sent.
Soft bounces
The number of soft bounces. A soft bounce is an email message that reaches the mail server of the recipient, but is returned before it reaches the recipient. One possible cause is a full mailbox of the recipient. A soft bounce message may still be delivered at a different time. The percentage of soft bounces is calculated based on the total emails sent.
Total emails accepted
The total number of accepted email messages. This is the number of messages sent, less hard and soft bounces. The percentage of total email accepted is calculated based on the total emails sent.
Email opens
Unique email renders
The unique number of recipients that has viewed the mailing (both fully opened and in the preview pane), registered through a tracking pixel. If a recipient opens the mailing several times, or if several tracking pixel requests are measured by forwarding the mailing, this counts as one email render per unique email address.
Unique opens
The unique number of recipients that has viewed the mailing (both fully opened and in the preview pane), registered through a tracking pixel OR when images are blocked and the recipient clicks on any link, including the unsubscribe link. The percentage of unique opens is calculated based on the total emails accepted.
Unique render rate
The percentage of unique email renders is calculated based on the total emails accepted.
Average render rate per recipient
The total number of renders divided by the number of unique renders.
Click data
Unique clicks
How many unique recipients clicked on one or several links in the mailing. If one recipient clicks on 3 links, this counts as one unique click-through.
Total clicks
How often did a recipient click on one or several links in the mailing. One recipient who clicks on 3 different links results in 3 Total click-throughs. The percentage of total clicks is calculated based on the total emails accepted.
Click-Through Rate (CTR)
The percentage of unique clicks is calculated based on the total emails accepted.
Click/Open Rate (CTO)
How many recipients have clicked on the link? This is calculated as the number of Unique click-throughs divided by Unique email renders.
Frequently asked questions
The basics of email statistics
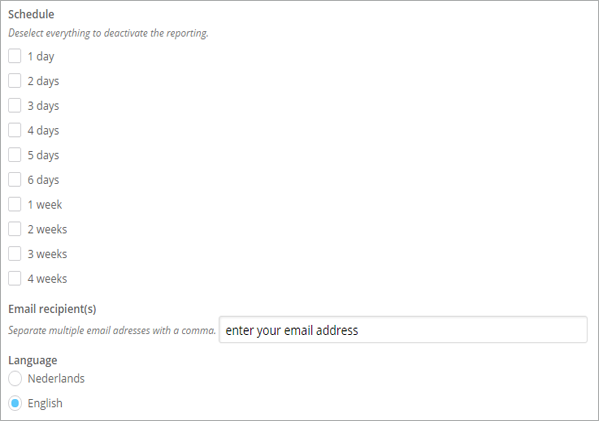
Go to statistics and click on scheduled email reports in the bottom left. Here you can specify after how many days you want to receive the statistics. Make sure you also specify what email address the statistics should be sent to, and what language they should be in.
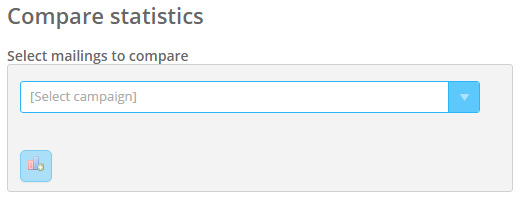
Comparing your email reports is quick and easy. You can see immediately which of your emails are performing well. You can even compare emails from different campaigns.
Go to Statistics > compare statistics. Click on the menus and select the campaign and email you want to compare. Click on the icon below the two menus to add another email to the comparison and enter the campaign and the email. Simply repeat this process if you want to add yet more emails to the comparison. Clicking the icon underneath the entry fields again will remove the email from the comparison.
You’re happy to see your email has been opened a lot, but how can you be sure it’s truly been opened properly by each of your customer groups? Surely you haven’t spent all that time personalising your content for no reason?
To find the answer to that, you can segment the results of your statistics. You can do so using the information you have in your database, so it only works if you actually used segmentation in your database. This then allows you to see (among other things) the difference in the open ratio between men and women, or the CTR per industry.
Simple click on the little funnel (![]() ) in the upper right in your results summary. You can then choose from all fields in your database. The only prerequisite is that the field in question can contain a maximum of 30 different values.
) in the upper right in your results summary. You can then choose from all fields in your database. The only prerequisite is that the field in question can contain a maximum of 30 different values.
Clicking behaviour tells you a great deal about what people thought of your email and which articles they found interesting. In order to properly measure clicks, this needs to be set up correctly. This is done through so called click names, also called titles. If you don’t add a click name to a link, clicks on that link cannot be included in the statistics. Once the click names in your email have all been included and the mailing is sent, the clicks will be registered.
Adding a click name in the Webpower block editor, or in an HTML email:
Enter all titles with links correctly.
Adding a click name in the Webpower drag & drop editor:
Add a click name to every URL
Webpower features a comprehensive sub-menu for analysing your emails. But where to start? And how to interpret the data? After this introduction, you will have learned all the basics.
Through the Summary, you can view the most important information regarding your email, and zoom in. You can export this summary in various file formats, or share the PDF file with others via email.
Did you know that... you can automatically receive the statistics by email? You can enable this via Reports > Scheduled email reports.
Segmentation
First, select your email in order to view the desired statistics. By default, the last actually sent email will be selected.
![]()
Click on the name to change the email or to choose a different segmentation.

Summary
View the general statistics in order to see how many emails have been accepted.
Click on the ‘i’ for an explanation of the term. For ‘unique click-throughs’, for example.

Details
Click on the test link of the summary to view the details. For ‘unique click-throughs’, for example, the details show you which links have been clicked.
Use the magnifier ![]() to zoom in on the details. This allows you to see which contacts clicked on this information.
to zoom in on the details. This allows you to see which contacts clicked on this information.

S.A.M.E.
The option S.A.M.E. (Support the Adoption of Metrics for Email) is a standard definition of email statistics in which the criteria regarding what counts as ‘unique open’ or ‘unique click’ have been determined. The statistics are presented accurately and uniformly, allowing you to compare them to other ESPs (Email Service Providers). This is useful when benchmarking various ESPs.

 (No Ratings Yet)